Longitudinal Profile
Given a DEM or a bathymetric layer as a source and a provided path on it, this tool allows to calculate the Longitudinal Profile and display it within an interactive chart.
Note
The Longitudinal Profile is not included by default in the MapStore configuration but it can be configured within an application contexts if needed. The plugin works only if the Longitudinal Profile WPS process is properly installed in GeoServer. Look at the official online documentation to learn more about this process and how to install it. The GeoServer module of the Longitudinal profile is available from Geoserver v2.20.x of Aug 2023.
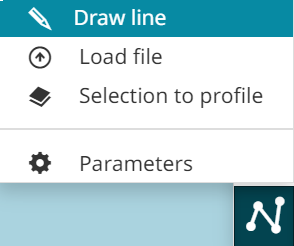
By clicking the Longitudinal Profile  button, available in the Side Toolbar, a drop down menu opens so that the user can manage the available options including different ways to calculate the profile:
- It is possible to draw a line directly on the map through
 button
- In alternative it is also possible to import a linear profile as a vector file (available formats for this are
GeoJSON,ShapeFileorDXF), through button
- Finally, through
 button, the user can also select a vector linear layer in TOC and then select the line feature representing the desired profile path on map.
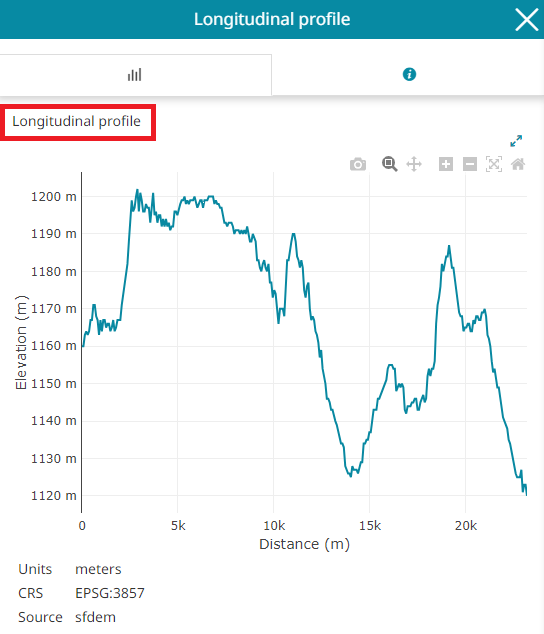
Chart
When the geometry of the profile path has been drawn on the map, the Longitudinal Profile panel opens and the chart appears in the Chart tab.
While the X axis indicates the distance from the starting point of the provided path, the Y axis indicates instead the height of points along the profile calculated from the provided path. The user can hover over the chart to interact between the chart and the line of the map as follows:
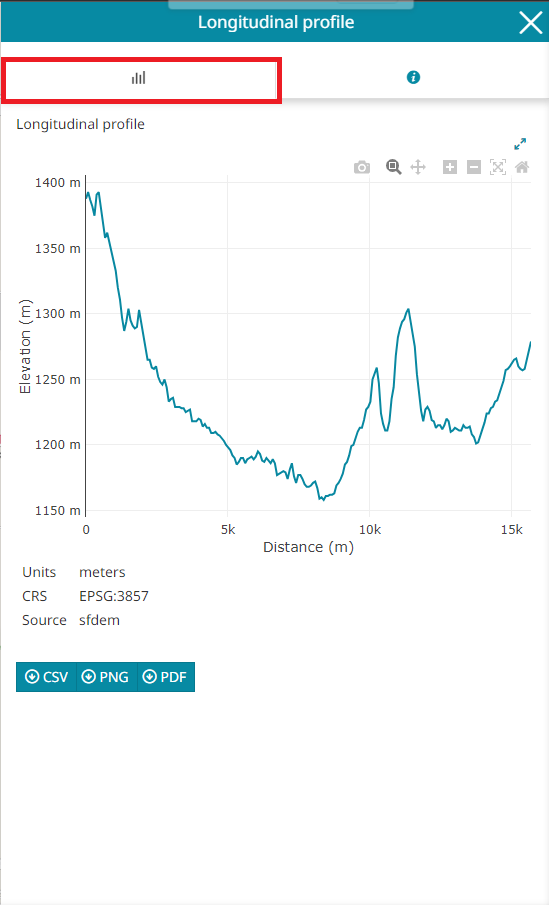
The Chart toolbar, displayed in the right corner of the chart, allows the user to:

-
Download the chart as a
pngthrough the button.
 -
Zoom the chart through the
 button.
 -
Pan the chart through the
 button.
 -
Zoom in the chart through the
 button.
 -
Zoom out the chart through the
 button.
 -
Autoscale to autoscale the axes to fit the plotted data automatically through the
 button.
 -
Reset axes to return the chart to its initial state through the
 button.
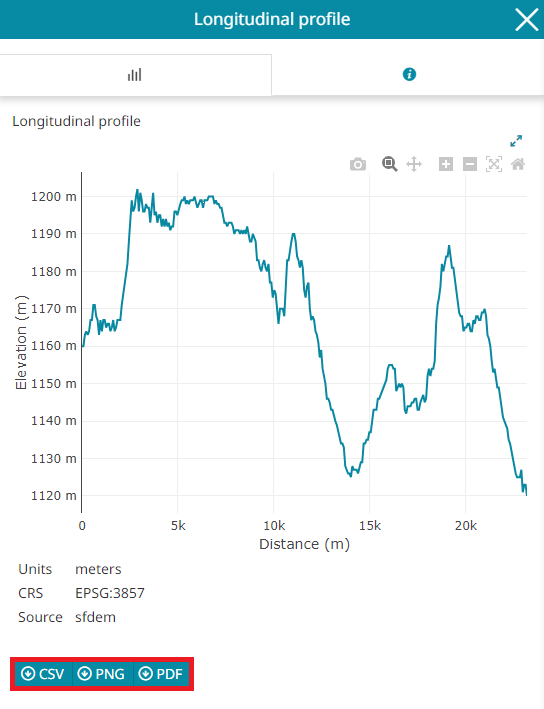
MapStore also allows to export the Longitudinal Profile as CSV, PNG or PDF file.
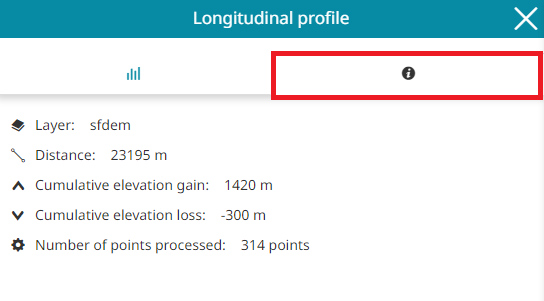
Information
In the Information tab are reported all relevant indicators related to the longitudinal profile calculation. In particular it is reported:
-
The layer used to calculate the profile
-
Total linear length of the profile
-
Cumulative elevation gain
-
Cumulative elevation loss
-
Number of points processed (the number of points varies according to the pitch chosen).
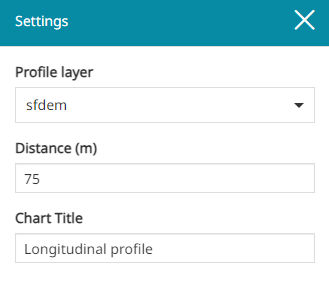
Setting Parameters
Through the  button it is possible to tune the profile properties. The available parameters used to calculate the longitudinal profile are:
-
The Profile layer choosing between the available layer on the dropdown menu
-
The Distance choosing the maximum distance between two points along the profile (in
m) -
The Chart Title to be used in the UI on the top of the chart.